Building a Smart City Prototype with OpenRemote, MQTT, and IoT
How my BSc thesis used OpenRemote, Docker, HTTP APIs, MQTT, and a people-counting use case to prototype adaptive Smart City infrastructure.
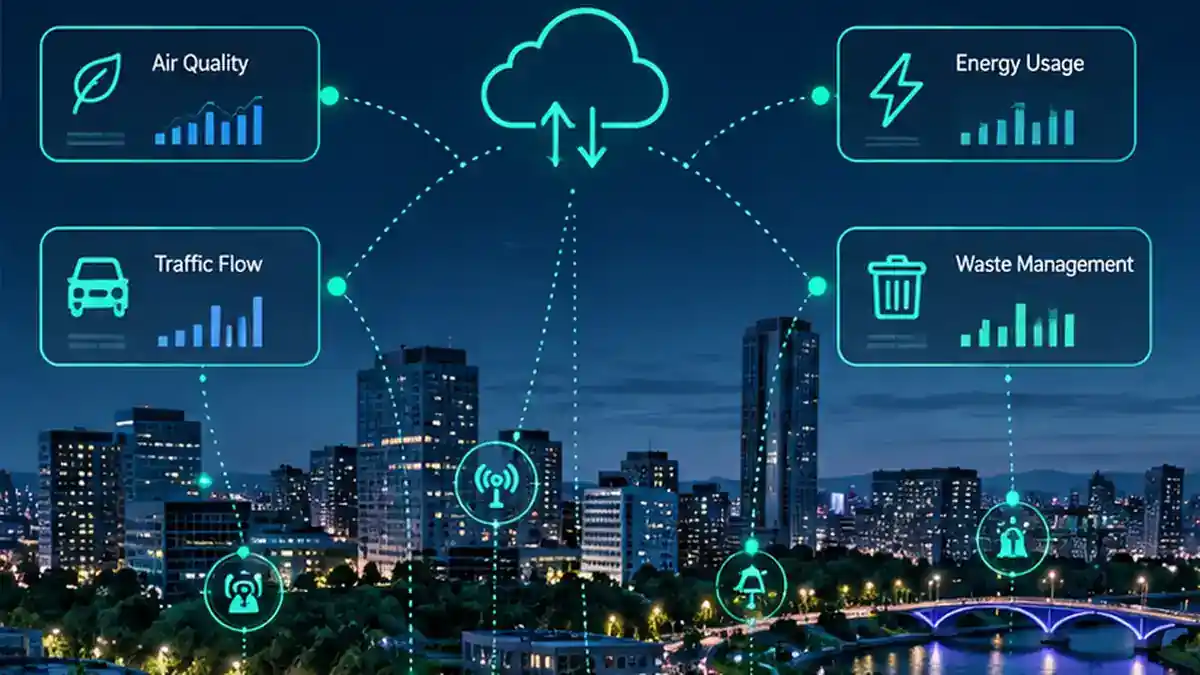
Building a Smart City Prototype with OpenRemote, MQTT, and IoT
How my BSc thesis used OpenRemote, Docker, HTTP APIs, MQTT, and a people-counting use case to prototype adaptive Smart City infrastructure.
Before my Master's work moved deeper into data science and machine learning, my BSc thesis focused on a different layer of the problem: how do you connect software, networks, APIs, and IoT-style devices into a working Smart City system?
The thesis, completed in 2022, explored Smart City software platforms and then used OpenRemote to build and deploy a practical prototype. The work combined platform configuration, cloud deployment, HTTP data ingestion, MQTT messaging, automation rules, and a simulated public-lighting scenario.
The goal was not to build an entire Smart City. It was to understand the infrastructure needed to connect physical-world signals to software that can monitor them and react automatically.
Choosing a platform
The first part of the thesis reviewed several open Smart City platforms, including:
- Snap4City
- OpenSmartCities
- CityOS
- OpenRemote
I selected OpenRemote for the implementation stage because it was directly usable for the project, had documentation that supported the required setup, and exposed the features needed for device and service integration.
| Platform | Role in the thesis | Outcome |
|---|---|---|
| Snap4City | Evaluated as an open Smart City platform | Considered |
| OpenSmartCities | Evaluated as an open Smart City platform | Considered |
| CityOS | Evaluated as an open Smart City platform | Considered |
| OpenRemote | Evaluated for platform features, installation, and integrations | Selected for implementation |
OpenRemote organizes a project around assets, agents, rules, dashboards, and location-aware data. An asset can represent something physical or logical — for example, a weather sensor, a light, a people counter, or a computer — while agents connect those assets to external services or data sources.
That model gave the project a useful abstraction: instead of treating every integration as a one-off script, devices and services could be represented inside the same management environment.
From local setup to a hosted system
I first installed and tested OpenRemote locally with Docker.
The next problem was availability. A local machine stops collecting data when it is turned off, which is not useful for a monitoring platform intended to run continuously. I therefore moved the platform to an Ubuntu 22.04 VPS hosted on DigitalOcean.
That deployment involved more than simply starting a container. The thesis documents the infrastructure work required around it:
- configuring SSH access,
- creating a non-root administrative user,
- installing Docker Engine and Docker Compose,
- configuring firewall access for SSH, HTTP, and HTTPS,
- running OpenRemote as a containerized service,
- configuring DNS through Cloudflare,
- and enabling encrypted HTTPS access.
I deliberately leave the historical IP addresses, credentials, and host-specific values out of this article. The important part is the architecture: the Smart City platform was moved from a local experiment to an internet-accessible service that could run continuously.
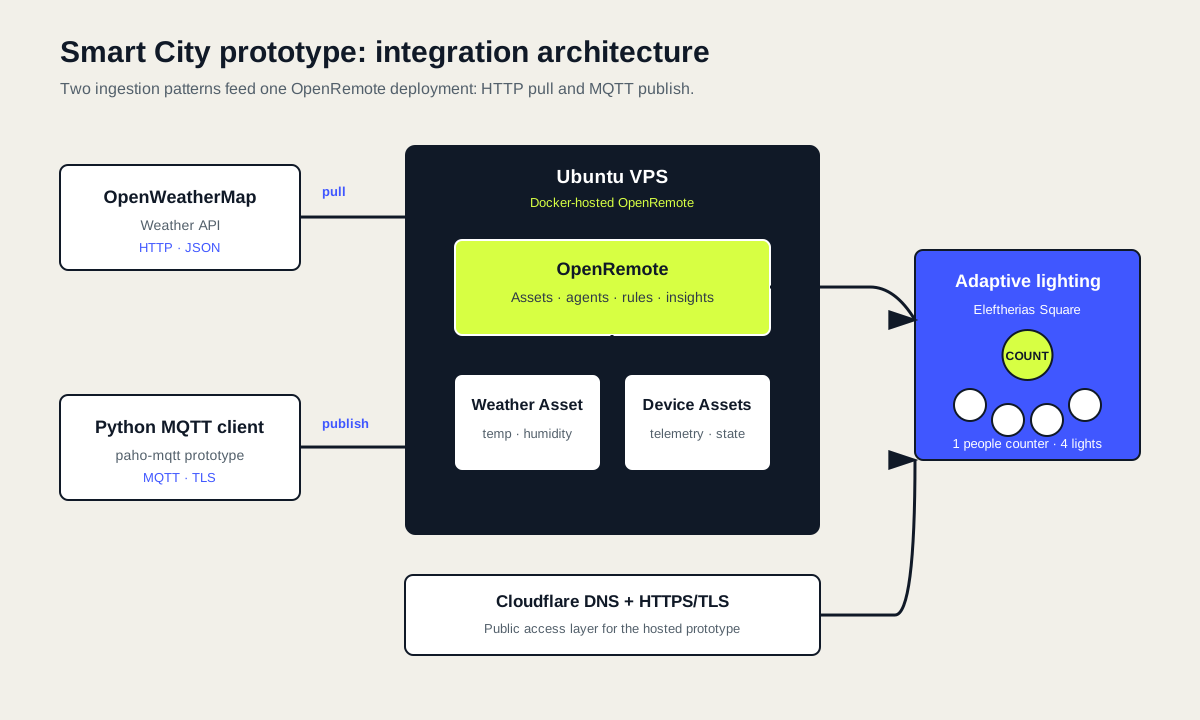
The deployment joined cloud hosting, API ingestion, MQTT device-style messaging, OpenRemote assets and rules, and a public-access layer into one prototype.
Adapting the map to the real area
OpenRemote's default project used a map centered on Rotterdam. For the thesis prototype, I changed that map so the platform covered the Serres and Lefkonas area in Greece.
The map data was handled as an MBTiles file. I used a Docker container with Node.js and Python tooling, together with a tile conversion workflow, to crop the source map to the geographic bounds needed for the project.
This mattered because the assets in OpenRemote are location-aware. Once the map represented the target area, sensors and devices could be placed where the prototype scenario was meant to operate instead of remaining abstract entries in a list.
Bringing live weather data into OpenRemote
The first external-data integration used the OpenWeatherMap API.
Inside OpenRemote I created a Weather Asset and a corresponding HTTP-based Weather Agent. The agent sent HTTP requests to the external service and received JSON responses containing weather data.
The integration extracted values such as:
- temperature,
- humidity,
- wind direction,
- and wind speed.
The request configuration included the API endpoint, coordinates, metric units, and JSON response handling. Attribute links then mapped paths such as the temperature and wind fields from the returned JSON into the corresponding OpenRemote asset attributes.
Conceptually, the flow looked like this:
OpenWeatherMap API
        ↓ HTTP / JSON
OpenRemote HTTP Agent
        ↓
   Weather Asset
        ↓
 temperature / humidity /
 wind speed / wind direction
That was a useful proof of one integration pattern: a Smart City platform can consume data from a conventional web API and make it available alongside device-generated data.
Connecting device-style data with MQTT
The second integration used MQTT, a publish/subscribe protocol commonly used in IoT systems.
For the prototype I wrote a Python MQTT client using the paho-mqtt library. OpenRemote acted as the MQTT endpoint, while a service account provided the credentials used by the script.
The client published data to OpenRemote over a TLS-enabled MQTT connection. During testing, a Computer Asset received changing CPU-usage-style measurements once per second, demonstrating that an external program could continuously push device data into the same platform used for the HTTP integration.
The important difference from the weather API was the communication model:
Python / device-side client
          ↓ publish
        MQTT
          ↓
      OpenRemote
          ↓
        Asset
The HTTP example pulled data from a service. The MQTT example demonstrated data being pushed from an external client.
| Integration | Direction | Protocol / format | Purpose |
|---|---|---|---|
| OpenWeatherMap → OpenRemote | Pull | HTTP + JSON | Ingest live weather variables |
| Python client → OpenRemote | Push | MQTT over TLS | Simulate continuous device telemetry |
| OpenRemote → assets | Internal mapping | Agents + attribute links | Store incoming values on platform assets |
| Assets → automation | Event-driven | WHEN-THEN rules | Convert measurements into actions |
Together they showed two different ways that a Smart City platform can ingest information from the systems around it.
The public-lighting scenario
The main use case brought the different ideas together.
I modeled a section of Eleftherias Square in Serres with:
- one People Counter Asset,
- four Light Assets,
- and a Simulator Agent producing a 24-hour sequence of people-count values.
The people counter represented the number of people present in the area during each hour. The lights then reacted to that value using OpenRemote's WHEN-THEN rules.
The rules described in the thesis included:
| People in the area | Light brightness |
|---|---|
| 0 | 0% |
| Fewer than 20 | 15% |
| More than 50 | 80% |
| 200 or more | 100% |
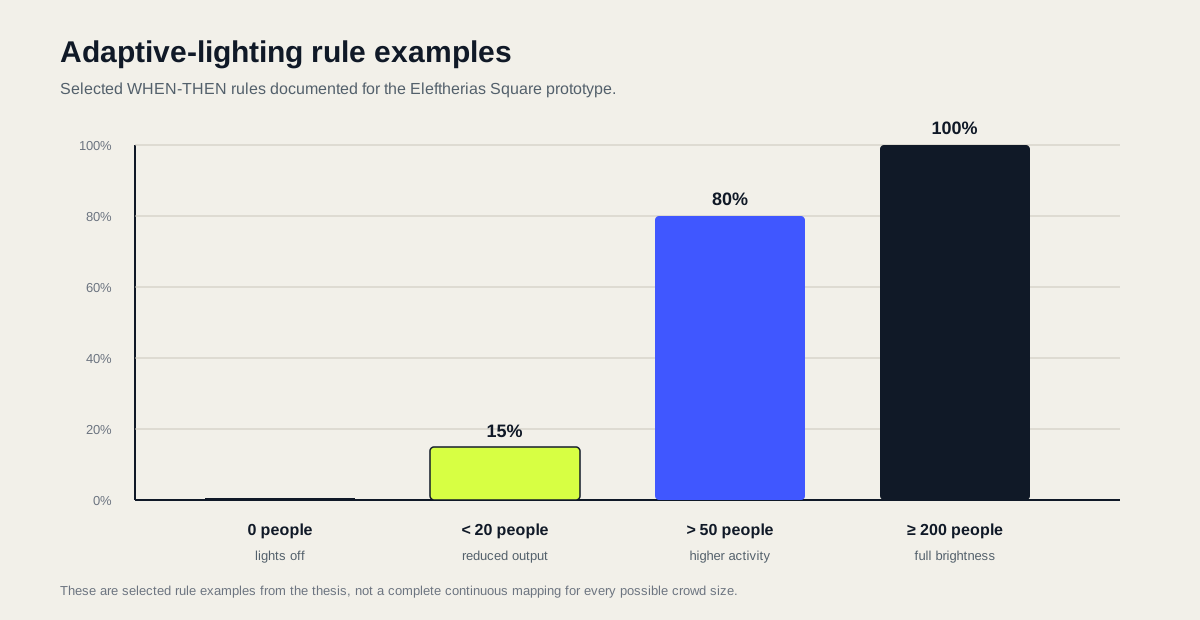
These are selected rule examples documented in the thesis rather than a complete continuous mapping for every possible crowd size.
This was intentionally a straightforward scenario. The point was to demonstrate the control loop:
People count
    ↓
OpenRemote asset
    ↓
WHEN-THEN rule
    ↓
Brightness command
    ↓
Four light assets
Instead of leaving street lighting at a fixed level regardless of activity, the system represented how lighting could respond to observed demand.
The thesis frames this as a basic energy-saving use case: lower activity allows the lights to operate at reduced brightness, while larger crowds trigger higher output.
Connecting the software model to physical hardware
The implementation used simulated values, but the thesis also examined hardware that could support a real deployment.
For lighting, it compared example smart-luminaire models including ALURA LED, Q-DROME, and HESTIA GEN2, looking at characteristics such as operating temperature, power consumption, light output, and efficiency.
For people counting, it examined the PeCo LC 2.0 family, including its measurement accuracy, Ethernet connectivity, operating range, and people-flow capacity.
| Device considered | Power / consumption | Output or capacity | Notable specification |
|---|---|---|---|
| ALURA LED | 10.9–74 W | 800–7,100 lm | Up to 113 lm/W |
| Q-DROME | 13–68 W | 1,970–9,720 lm | 110–136 lm/W |
| HESTIA GEN2 | 10.5–102 W | 900–14,200 lm | Up to 164 lm/W |
| PeCo LC 2.0 people counter | 7 W without heating; 30 W with heating | Up to 500 people/min | 98% stated accuracy; 32 m area width |
That hardware comparison was important because an IoT architecture only becomes useful when the software's assumptions can eventually map onto devices with realistic interfaces and operating constraints.
What this project demonstrated
The final prototype tied together several layers that are often discussed separately:
- IoT concepts for representing sensors and devices,
- HTTP APIs for integrating external services,
- MQTT for continuous device-style messaging,
- Python for the MQTT client,
- Docker for packaging and running the platform,
- Linux and VPS administration for continuous hosting,
- DNS and TLS for exposing the service securely,
- geospatial configuration for placing assets in the target area,
- and automation rules for turning incoming data into actions.
The Smart City use case itself was simple, but that simplicity was useful. It made the boundaries between the components visible.
A sensor or external service produces data. A communication protocol transports it. The platform stores and represents it. Rules interpret it. An actuator or device receives the resulting action.
That end-to-end path was the main engineering value of the project — and it became a foundation for the more data-intensive systems I worked on later.